

After a successful week, the Bitcoin bears trapped the bulls, ultimately breaking down the positive route.
After finally breaking out the $4,000 mark, Bitcoin had yet another break. Only this time was on a downward spiral.
For the past week, Bitcoin bulls tried maintaining support levels from above the resistance line but failed to do so this Monday.
As a result, the coin tested the support levels from below.
It is not certain whether this inability for stabilization above the $4,000 line will lead to further drop or not.
Some experts believe the coin may have to drop even more, to the resistance levels of $3,700, in order to get an ascending trend line once more.
Since the decrease, a bullish move was spotted as the coin crossed over the $4,000 mark yet again.
For now, it is unclear which direction Bitcoin is going to take next, as both routes are highly possible.
Still ranked first on the charts, this week’s Bitcoin market cap reached $71.3 billion.
Bitcoin has a dominance of 50.9 percent in the overall market, which this week reached $137.1 billion.
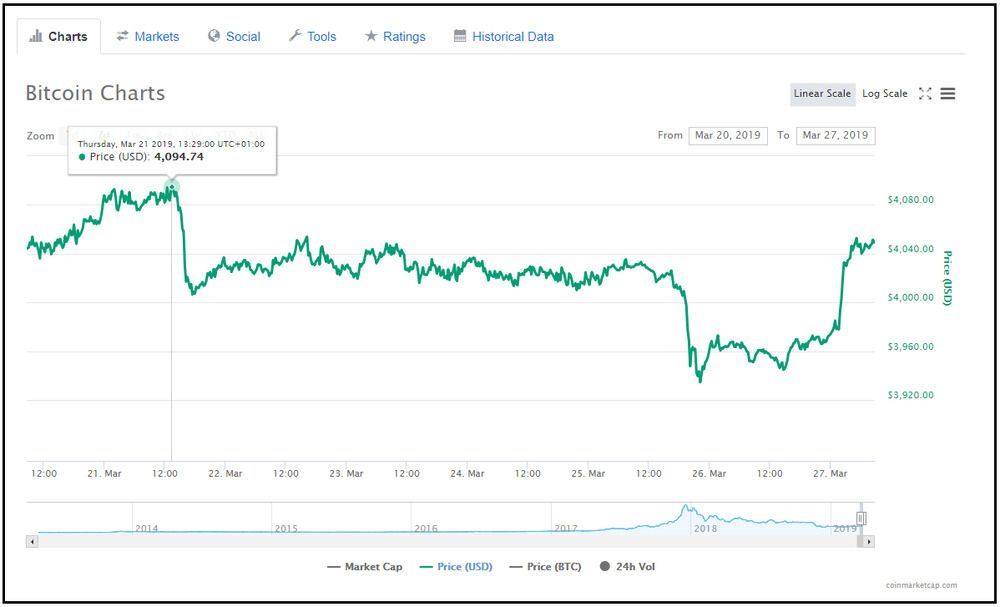
Bitcoin Price: Weekly Chart
Despite the descend on Monday, many bullish moves were identified in the days leading up to the weekend.
The break above the $4,000 line proved that the bulls might, in fact, strive to trade above the line.
However, the sellers did fight hard near the resistance levels of $3,950 and $4,000 against the U.S. Dollar.
Even though bearish moves appeared correspondingly, the support area of $3,800 responded as a stable buy zone.
By the end of the weekend, the buyers were superior and pressured Bitcoin’s price above the mentioned resistance levels.
After what we considered a very successful week for Bitcoin, the situation became fragile.
The big picture shows usual highs and lows, ultimately forcing the coin to retest higher support zones from above and below.
Crossing over the $4,000 mark on March 16, Bitcoin remained stable for the next following days.
Fluctuating around the $4,000-$4,100 area, the traders anticipated some future advantageous positions.
Bitcoin’s weekly price chart showed the highest high on Thursday, March 21, when the price reached $4,094 against the U.S. Dollar.
The exact same day, a few hours later, a minor descending line was also spotted. Right after reaching the highest point, the price of Bitcoin decreased to $4,006.
Coming this close to the $4,000 line showed a moment in favor of the bears.
Although it looked like the bears trapped the bulls, the upcoming weekend was a hopeful start for a renewed escalation.
As always in trading, things did not really go accordingly to the plan, as we can conclude this weekend was one of the worst for the traders.
We usually spot very favorable weekends where the Bitcoin price varies between higher rates—this past weekend, the highest mark the price reached was $4,053 on Friday, March 22.
Regardless of how small the progress was, the price of Bitcoin seemed calm for the following days.
It was important for the coin to stay in a positive zone, and the situation did not indicate a major crush still.
On Monday, March 25, Bitcoin’s price again went below the line that the bulls pushed so hard for.
It reached a price of exactly $3,934.50 against the U.S. Dollar. The circumstances made this the ultimate lowest low this week.
After the downside pathway, the bulls gained traction and the price of Bitcoin managed to rise, breaking the $4,000 resistance line yet another time.
At the time of writing, Bitcoin can be found at $4,052, and we only hope it will remain in this positive elevation.

The lowest point (up) and the highest point (down).
Bitcoin Price: Daily Chart
From the daily chart of Bitcoin, the main boundaries of support and resistance can be clearly seen.
Due to breaking down the one-day ascending trend line, Bitcoin is now facing support of $3,950 from the above and $3,850 from below.
The 50-days MA (moving average), which currently is positioned around $3,800, locates further support for the coin before it hit a key support zone of $3,700.
On the other hand, the upped boundary shows the next resistance laying at the $3,930-$3,950 area.
If Bitcoin succeeds to break above, the coin will retest the $4,000 level again before it reaches the significant $4,050 resistance level.
The relative strength index displayed a fall down, which is considered a positive sign for the rate hold.
Along with the ascending trend line, the important RSI support that included 56 levels were broke down.
Now, the RSI is approaching the 50-level together with the abiding declining trend line.
Repeatedly, the overall trading volume did not show any significant improvements.
Being under such low-volume conditions can signify an eventual moving of the market. This entails fear in the market altogether.

Bitcoin Price: 4-Hour Chart
The crucial bearish trend line that followed this week, as shown in the four-hour chart, was cleared with a resistance of $3,945.
This break of the major triangle pattern settled the BTC/USD pair above the $4,000 area and the 100 simple MA.
This chart of Bitcoin also showed the MACD breaking its zero-line, and the commonly downwards trending MACD suggested the bears were in control.
However, the bulls still successfully defended the weekly candle, ultimately keeping the coin in the positive zone.
As of now, the technical indicators demonstrate the MACD is gaining pace into the bullish zone, but it’s difficult to tell what is next for Bitcoin.
Will it maintain trades above the $4,000 line or will it settle for low support levels? Only time will show.


)
)
Comments (No)