

This week, Bitcoin bulls aimed for a new price record and broke the $8,000 for the first time since July 2018.
Another week, another victory for the bulls.
Just a week ago, we mentioned about our struggles to understand what the continuous ascending momentum meant, and this week all our questions have been answered.
Needless to say, the world’s largest cryptocurrency had a positive week breaching resistances and moving upward to new higher goals.
This week, the bulls manage to break up two significant targets, and the price of the coin could be found above the $8,000 line for the first time since last July.
In last week’s price analysis, we discussed Bitcoin’s rise to a new 2019 high, and here we are several days later witnessing yet another conquering of a peak for this year.
What is even more interesting is that Bitcoin traded under $3,800 less than three months ago.
This represents the state of the crypto market in a nutshell.
Since we are already familiar with the fact that every asset that surges excessively fast eventually has to slow down and correct, we are aware that anything is possible and anything can happen.
For the past seven days, Bitcoin reached a market cap of $141.4 billion and a dominance of 58 percent.
The total market cap reached $244.1 billion. Bitcoin continues to be #1.
Bitcoin Price: Weekly Chart
It’s safe to say Bitcoin excelled in this one-week period. For a long time, we have not seen the coin performing as well as it once did in late-2017 and early-2018, so the majority of crypto analysts went on to describe Bitcoin as “amazing.”
It’s important to note that this adjective actually points out to the experts’ beliefs that further gains are unavoidable.
As usual, in order to reach new highs the bulls had to pull back. It is true that bearish trend lines were once again formed.
This, however, did not make a whole lot of difference in the bigger picture as the bulls pushed Bitcoin relentlessly.
At the end of last week, Bitcoin was found at an exact price of $5,876 against the U.S. Dollar.
The highest point, as presented in our last price analysis, was reached on Tuesday, May 7, when the coin was seen extremely close to the $6,000 line.
However, Bitcoin failed to cross over the target and settled at a price of $5,955, which was the highest point of last week.
Unlike the last displayed chart, this week’s chart expresses a gradual climb towards the new price record.
Starting from where we left off, Bitcoin—then found near the $5,800 line—started moderately moving up.
During last Wednesday, the price increased to $5,897, which marked the lowest point of this week.
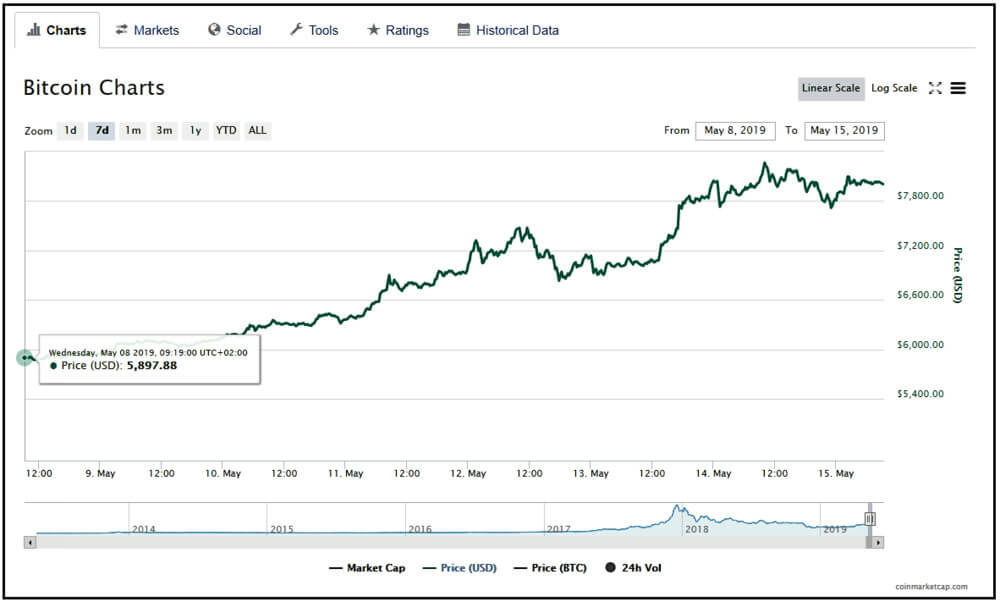
After this, the bulls joined forces. Refusing to settle below the $6,000 line, they pushed Bitcoin to cross over this point the next day, Thursday, May 9.
By doing so, the strong resistance that lied at the $6,000 level was finally breached. That is when the once-strongest resistance level became the major support level for Bitcoin.
And the bulls did not stop there—for the next following days, we observed even more significant movement.
Approaching to the weekend, the price of Bitcoin started to rise at a faster pace. On Saturday, Bitcoin was found very close to the $7,000 line.
This signified a rapid surge since two important levels were reached in less than five days.
After months of being disappointed by the weekends as the best time for the traders, the bulls again proved why the notion was set in the first place.
On Sunday, May 12, Bitcoin rose above the $7,000 mark, settling at an exact price of $7,465 against the U.S. Dollar.
Reasonably, brand new resistance and support levels were formed, indicating the bulls are nowhere near a stop.
Because the weekend was surprisingly very advantageous for Bitcoin, we were interested in the coin’s next route.
Such beneficial activity can mean either one of two things: The price will start significantly dropping down or it will continue its climb.
The worse option was the case that actually occurred. A bearish trend line was formed on Monday, May 13 when the price of Bitcoin was again found below the $7,000 line.
Although the bears looked in control, the bulls did not give in. During the same day, the price was fluctuating back and forth, finally climbing above the line another time.
Since then, Bitcoin is only seen moving upward.
Due to the gained traction, on Tuesday the bulls broke above the $8,000 line and reached yet another milestone.
Just a week ago, this area was seen as a future goal for Bitcoin, therefore the aim was hit sooner than expected.
The same day, Bitcoin arrived at an exact price of $8,265 against the U.S. Dollar, and this value marked the highest point of the week.
Following this success, the price started slowly descending. The coin again went below a momentous line, this time the $8,000 line, and was variating in the area of $7,800 and $8,100.

At the time of writing, Bitcoin’s price is at $7,990 against the U.S. Dollar.
Because it is so close to the strong and significant support of $8,000, we remain hopeful the bulls will push the coin above the line again and strive for even higher spots.
Bitcoin Price: Daily Chart
Different from the weekly chart, the 24-hour period showed that Bitcoin endured relatively large levels of volatility.
Opposed than the gradual climb of the weekly display, the one-day chart further showed how unstable it actually was.
By looking at the graph, you can clearly see the uncertainty and fluctuation of the market.
For the past week, not only did the Bitcoin bulls manage to move the borders to higher levels, but also many other aspects of the market ecosystem profited from this rapid surge.
The trading volume was one of them. Finally, after weeks of stagnation, we were able to see some green volume.
This means that the market is currently looking solid and money is being driven to it. Like a shred of evidence, this can also be spotted from the OBV (On-Balance Volume) indicator on the daily chart.
As mentioned in our prior analysis, the RSI (Relative Strength Index) of the daily chart showed Bitcoin nearing the levels of 88-90.
After reaching the 88 RSI level, the bulls failed to break above. For now, the RSI found crucial support at 80.

Bitcoin Price: 4-Hour Chart
Similar to the daily chart, the hourly Bitcoin price chart also revealed the bearish trend line that was formed on the chart for the BTC/USD pair.
The area the bears were dominant was near to the resistance of $8,100. The pair went along to retest the support area of $7,600 before rising above $8,200 again.
The pair is likely to climb back to the mentioned area, and for now, remains well above $7,600.
The Simple Moving Average was kept above the 100 level, therefore the hourly Moving Average Convergence Divergence shows aims to cross over in the bullish zone again.
The RSI displayed on the hourly chart demonstrated the RSI for the BTC/USD pair can be found above the 50 levels.
Right now, followed by the $7,630, the major support level lies at an exact price of $7,850 against the U.S. Dollar.
The major resistance levels can be found at $8,100, $8,150 and further up the line at $8,300.
Besides the formed bearish line, the bullish movement of Bitcoin makes us optimistic about what is next for the most dominant coin on the crypto market.


)
)
Comments (No)