

Following the new 2019 high, the price of Bitcoin dropped below the $8,000 line again. Where is the bottom?
Following a week full of victories and what seemed to be a movement towards new higher levels, the bulls broke down and pulled Bitcoin below the $8,000 line again.
As we always say: Nothing is ever sure in crypto, so what we can do is hope for the best but expect the worst.
For the past seven days, we witnessed Bitcoin—and the market as a whole—experiencing a round of major volatility, consequently putting the upward momentum in grave danger.
We saw the support failing and new support and resistance levels forming around much lower levels.
As of now, the corrections are considered insignificant and it is both risky and early to take a short position.
Despite the negative occurrences, some analysts noted that Bitcoin still shows bullish signals and that the coin is still holding above the parabola directed upward.
Combined with the recent uptrend created by the bulls, there are analysts that believe further gains are inevitable.
We guess we will have to wait to see what actually happens and whether or not these signals were interpreted right.
Although Bitcoin’s dominance has decreased to 55.6 percent, the world’s first cryptocurrency is still ranked #1.
The total market cap reached $249 billion, while Bitcoin’s market cap reached $138.4 billion in the past week.
Compared to last week and the week before that, we can see the number dropping down significantly, and we can only hope for a more positive turn during the upcoming week.
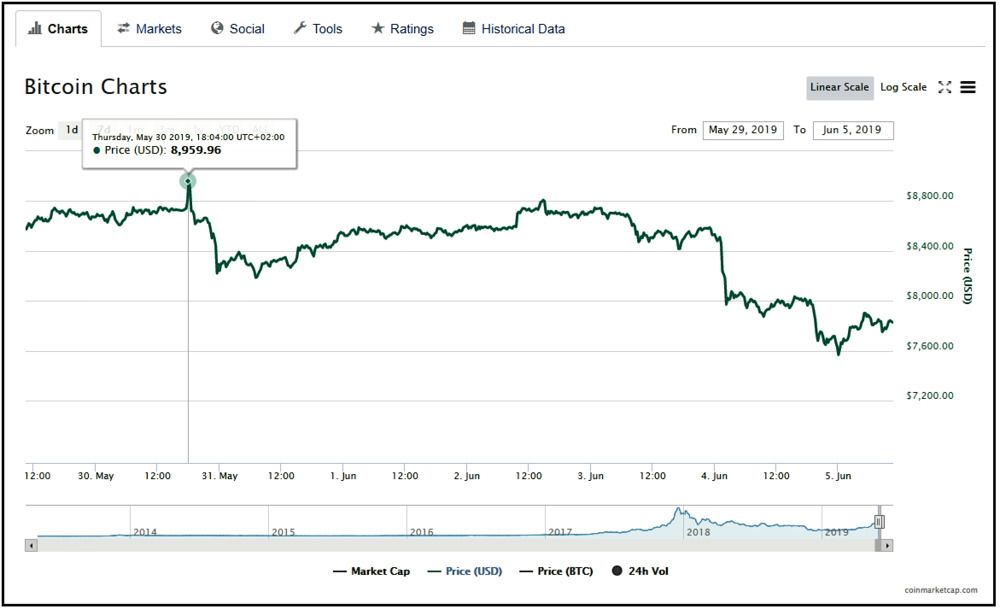
Bitcoin Price: Weekly Chart
It takes just one glance at the weekly chart of Bitcoin’s price to notice the bout of volatility Bitcoin and its market experienced for the past week.
Even though the chart displays a positive direction at first, things drastically changed in the last few days.
By looking at the chart, we can assume the bulls struggled to overpower the bears, and that is something they were not able to do this time around.
The bulls took charge of the market, but the bears definitely took charge of the BTC/USD pair and brought it down to a disadvantageous mark.
Dissimilar to the chart of our last Bitcoin price analysis, which looked good and stable, this chart clearly shows that the bears were surprisingly powerful and forced the bulls to struggle.
Starting from last Wednesday, May 29, everything looked in favor of the bulls.
After reaching a new 2019 high for the second time this year, we were optimistic the bulls would keep pushing the price to reach higher milestones.
At the end of our last analysis, the price of Bitcoin was at $8,544 against the U.S. dollar, and it kept increasing during the same day.
On Thursday, May 30, Bitcoin bulls were spotted still in control, resulting in Bitcoin’s price going in an upward direction.
On the same day, the bulls succeeded to place the coin near to the $9,000 mark, settling at an exact price of $8,959.
This marked the highest point on this week’s chart.
Such achievement lasted a short period of time before correcting to lower levels again.
As displayed, right after reaching the top of the past seven days, Bitcoin bulls failed to guard the resistance and violently broke down to already-familiar levels.
Basically, this is where the struggle begins, as this momentum is believed to be the beginning of the struggle.
From that point up until today, the strength of the bulls was shaken, which ultimately resulted in major fluctuations, inability to stabilize and finally dropping below the major $8,000 mark again.
Another week in a row, the weekend was a fortunate time for the market.
If you remember, at the beginning of this year, the weekends were a terrible time for the cryptocurrencies, dampening their reputation as the most advantageous time of the week to investors.
However, this changed over the past several weeks. Although we can see the bulls fighting to be in control, the weekend as a whole was in their favor.
Following the price of $8,191 on Friday, May 31, the bulls did not fail to push Bitcoin up during the weekend.
On Sunday, June 2, the price of Bitcoin climbed to $8,799.
Sadly, with the beginning of the new week, a wave of uncertainty rolled over.
On Monday, June 3, the price of Bitcoin gradually started going down.
On Tuesday, however, the slow downward pattern was interrupted when the coin dropped significantly, touching the base of the $8,000 line again and unfortunately going below it.
The same day, the price of Bitcoin was $7,971, which led us to believe the overall market sentiment would be turning bearish.
On June 4, with the price dropping down majorly the BTC/USD, sellers were in full control.
The big and important support formed around the $8,000 mark was once again breached, and before the market crumbled further under the selling pressure, the price of Bitcoin trended horizontally for quite some time.
Since yesterday, Bitcoin’s price continued to vary, and such variations can be seen on the chart as well.
On Wednesday, June 5, the price of Bitcoin fell even more, settling down at $7,567.
This marked the lowest level that was reached over the course of the last seven days.

At the time of writing, the price of Bitcoin is $7,823 against the U.S. dollar, which means that the bulls persist on getting in control again.
After all, such a scenario might be the positive sign many analysts were noticing when future gains were announced forthcoming.
Bitcoin Price: Daily Chart
Same as the weekly chart, the daily chart depicting Bitcoin’s price is not stable as well.
Reasonably, due to the struggles the bulls experienced, it’s no wonder there are many fluctuations displayed on the daily chart.
As expected, this graph contains many bearish signs.
Due to the major price drop, the daily trading volume was hit hard because the volume candle of the buyers was lower than the volume of the sellers.
The daily relative strength index, once again, is very close to the significant level of 50—it is now trending at 47.5.
The last time it was below this area was four months ago.
The moving average is also hitting bearish momentum as it is trading below the 20-day SMA curve.

Bitcoin Price: 4-Hour Chart
Similar to the daily chart, the hourly chart also displays bearish signals.
On the hourly chart of the BTC/USD pair, two bearish trend lines are formed with resistance levels near $7,950 and $8,200.
As previously mentioned, the relative strength index (RSI) is near the 50 level, and the hourly RSI shows it is moving higher; therefore, it is likely to reach it in the near term.
Unlike the daily moving average convergence/divergence (MACD) that shows bearish signs, currently the hourly MACD shows the bulls are gaining pace and are slowly crossing over into the bullish zone.
As of now, followed by the drop, the major support level lies at $7,600.
Further below, there is the $7,200 level and the major support area of $7,000.
The major resistance levels, on the other hand, are near to the $8,000 area.
Above, there are the levels of $8,200 and $8,400, $8,500, $8,800 and hopefully $9,000.
Even though the technical indicators seem to follow a bearish path, there is always a possibility of an upside correction.
The struggle is tough and real, but everything is possible.


)
)
Comments (No)