

Weekly Bitcoin Price Analysis: A Further Decline or a New Higher Breakout? What Is Next for Bitcoin?
We all know how volatile the crypto market is. It has never been a stable one, and this feature is a blessing and a curse at the same time.
After a week of victories and conquering a new 2019 high, what we expected to see is a gradual ascending line on the Bitcoin price chart.
Unfortunately, we witnessed the exact opposite.
Over the course of the past seven days, the price of the most dominant cryptocurrency was changing a lot, going above and below the $8,000 line.
Such variations can be perceived as signals that the bulls are trying to get their traction back.
Based on previous similar situations, it is the most uncertain before the next big break.
The Bitcoin bulls slowly took a step back, moving into lower ranges of support and resistance.
In the past week, Bitcoin reached a dominance of 56.4 percent, which is significantly lower than last week.
The total cryptocurrency market cap reached $249.5 billion, while Bitcoin’s market cap reached $139.3 billion.
Besides the failures, Bitcoin continues to be ranked first place.
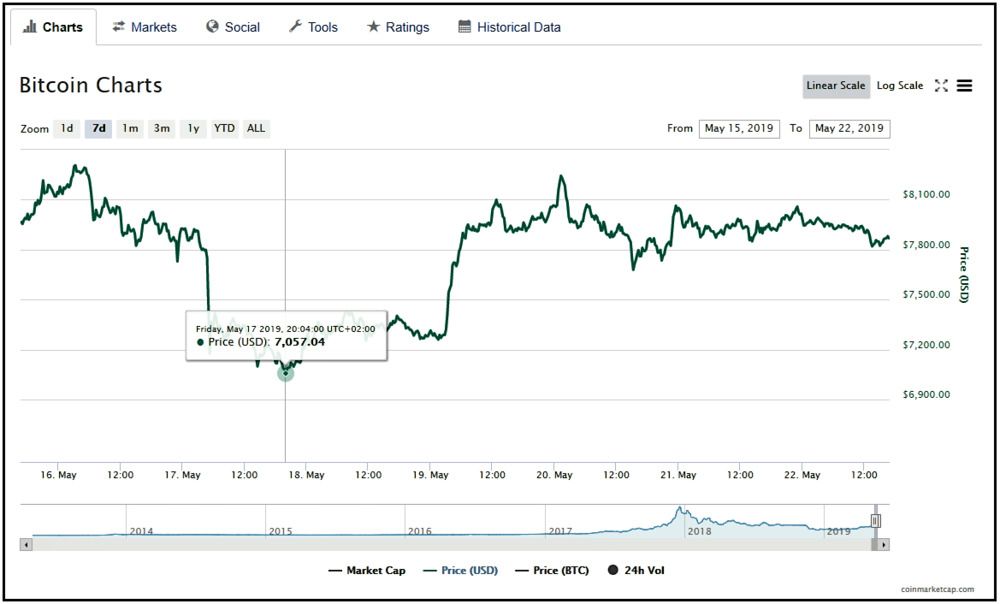
Bitcoin Price: Weekly Chart
Although the majority of crypto experts described the future success of Bitcoin as “unavoidable,” the coin failed to meet the high expectations.
Opposite than last week, when we could clearly see Bitcoin going up to new higher positions, this time around the only thing we see from the chart is a battle.
Bitcoin bulls attempted and struggled to climb further, and they conflicted the bears when a huge bearish line was formed.
However, most of the battles were unsuccessful.
In the past seven days, Bitcoin’s dramatic price swings were not good for its market nor for the trading volume.
In short, Bitcoin bulls were not successful in balancing their efforts, which caused the various fluctuations this week.
This week’s Bitcoin price chart begins with the continuous climb that was mainly present in the past week.
At that time, as shown in our last analysis, Bitcoin was priced at exactly $7,990 against the U.S. Dollar.
As noted, last week’s line on the chart displayed the slow movement upward, which led the coin to cross over the $8,000 line once again.
On Thursday, May 16, Bitcoin was found at a price of $8,299.

Around this time, new higher levels of support and resistance were formed but did not last for long.
Right after reaching the top of this week, the bulls began failing, and with that came the transition of Bitcoin in a negative direction.
With the start of the weekend, Bitcoin can be seen dropping down significantly, creating a bearish line.
In the course of those three days, the bulls were fighting the bears poorly, which caused Bitcoin to go below the $8,000 line.
What is even more unfortunate, the coin dropped so much that not only it went below the highest mark of this year, but it also settled near the $7,000 line.
On Friday, May 17, Bitcoin reached $7,057.
After this, the bulls managed to gain traction. It is clear that they fought hard as many oscillations can be spotted on the chart.
The hard work paid off, as the price of Bitcoin can be seen moving up by the end of Sunday.
On Monday, May 20, the bulls again tried and succeeded at crossing over the $8,000 line and the coin settled at a price of $8,243 against the U.S Dollar.
After the disastrous weekend, the bulls proved they still have the strength to fight the bears.
This served as an example of how many drastic changes can take place in the course of only a few days—speaking to the overarching vulnerability and uncertainty of the crypto world.
After climbing to another peak of this week, Bitcoin continued on a very volatile path.
Even though the bulls looked in control, the bears did not give up. Ultimately, Bitcoin went below the $8,000 line for another time.
Since then, the price of Bitcoin can be only seen fluctuating back and forth, going above and below the significant mark.
In the course of the next few days, Bitcoin can be seen crossing over the $8,000 level at least three times, which is accompanied with going below the same level for the same number of times.
At the time of writing, Bitcoin price is at $7,866 against the U.S. Dollar. Although the bulls started this week strong, the bears took over.
No one can tell for sure which direction Bitcoin is going to take next.
Bitcoin Price: Daily Chart
Very similar to the weekly chart, the daily chart revealed yet another fluctuating line.
By looking at the graph, it is clear that a bearish line was formed again, though the bulls fought to be in control.
As usual, major drops and rises can be spotted, affecting many different areas of the crypto industry.
The trading volume, just as we mentioned earlier, was hit hard, after finally going past the point of stagnation.
Last week, a green trading volume was displayed, pointing to more money flowing into the market.
However, this week, the volume is shown decreasing on a day-to-day basis.
The daily relative strength index (RSI) also lost its momentum. This led the index to now trade around the 67 level.
Compared to the past month, the last daily RSI is very low even though it is in the bullish territory.

Bitcoin Price: 4-Hour Chart
On the hourly chart of the BTC/USD pair, it can be seen that the bullish trend line was breached near the $7,980 mark with significant support.
From the $7,578 swing low to $8,172 high the pair labeled the 61.8% Fib retracement level of the last wave.
On the downside, the main support levels lie at $7,820 and $7,800.
To prevent a downside break, the 100 hourly SMA (Simple Moving Average) is also found near the $7,800 line.
In case of more losses occurring, the price is most likely to revisit lower support levels, such as $7,660 and $7,620.
The $8,000 mark is the immediate resistance on the upside.
If the bulls do succeed at breaking above the $8,000 line again, the barrier is likely to push the price towards the level of $8,150 against the U.S. Dollar.
The hourly relative strength index for the BTC/USD pair has a bearish angle and is currently below the level of 50.
The hourly MACD (Moving Average Convergence Divergence) also contains a few negative signs, and it is slowly moving into the bearish zone.
As of now, followed by $7,660, the major support levels lie at $7,800.
The major resistance levels can be found at $8,000, $8,120 and $8,200.
Even though the technical indicators are nowhere near positive, a strong move is likely to take place soon.
Such a situation, when a cryptocurrency is stabling around a specific price, is the proverbial “calm before the storm.”
So regarding the volatility, we decide to embrace it if it means Bitcoin will be moving up in the near future.


)
)
Comments (No)